Video-based Sympathetic Arousal Assessment via Peripheral Blood Flow Estimation
Biomedical Optics Express 2023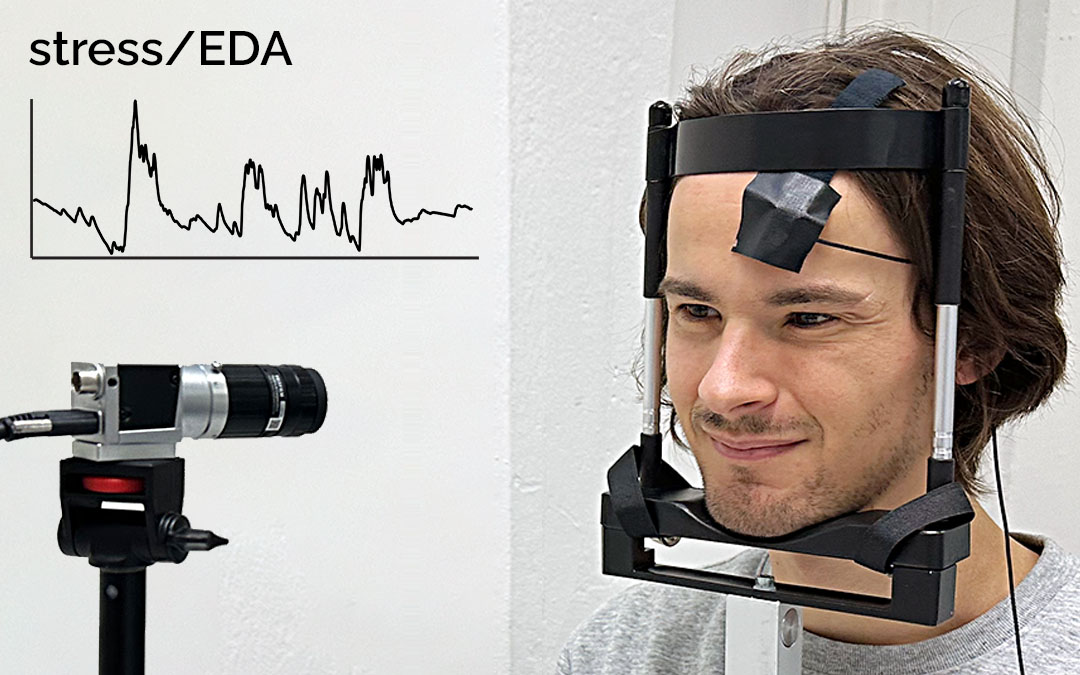
Abstract
Electrodermal activity (EDA) is considered a standard marker of sympathetic activity. However, traditional EDA measurement requires electrodes in steady contact with the skin. Can sympathetic arousal be measured using only an optical sensor, such as an RGB camera? This paper presents a novel approach to infer sympathetic arousal by measuring the peripheral blood flow on the face or hand optically. We contribute a self-recorded dataset of 21 participants, comprising synchronized videos of participants’ faces and palms and gold-standard EDA and photoplethysmography (PPG) signals. Our results show that we can measure peripheral sympathetic responses that closely correlate with the ground truth EDA. We obtain median correlations of 0.57 to 0.63 between our inferred signals and the ground truth EDA using only videos of the participants’ palms or foreheads or PPG signals from the foreheads or fingers. We also show that sympathetic arousal is best inferred from the forehead, finger, or palm.
Reference
Bjoern Braun, Daniel McDuff, Tadas Baltrusaitis, and Christian Holz. Video-based Sympathetic Arousal Assessment via Peripheral Blood Flow Estimation. In Biomedical Optics Express 2023.
Project Overview
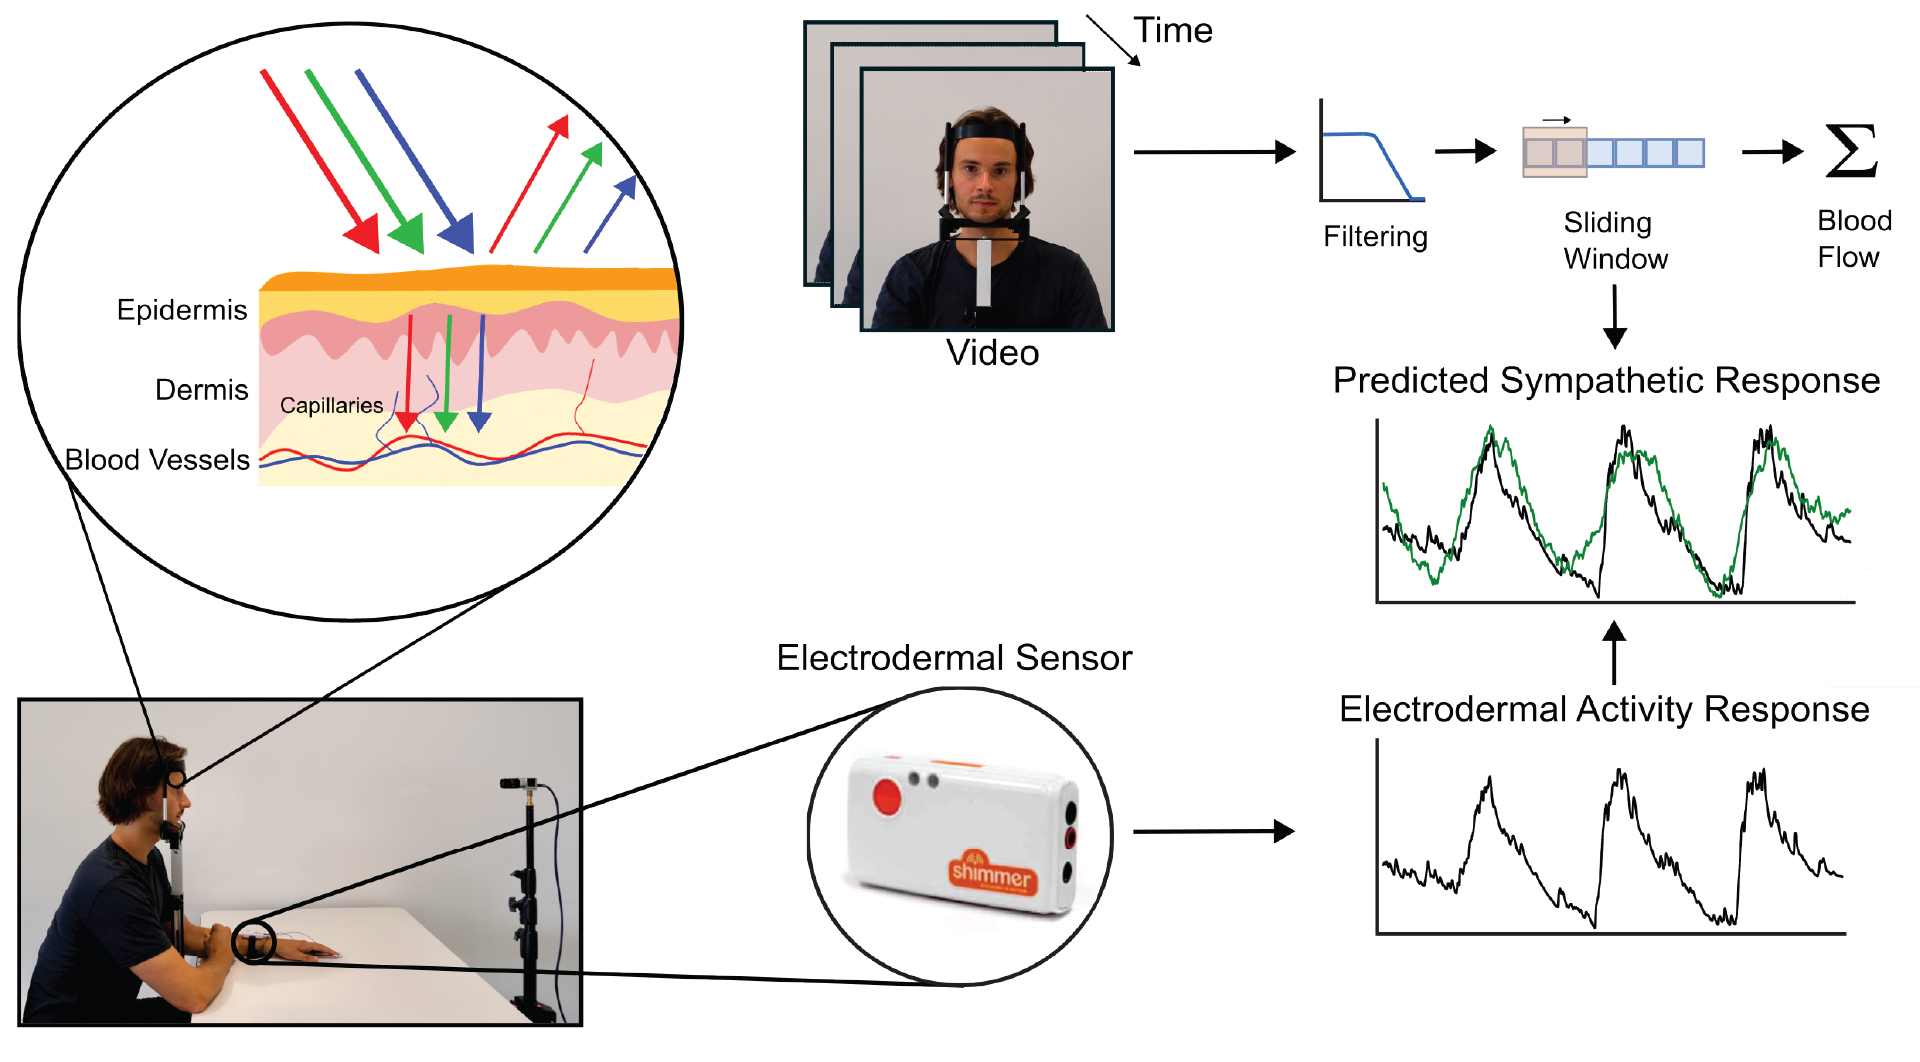
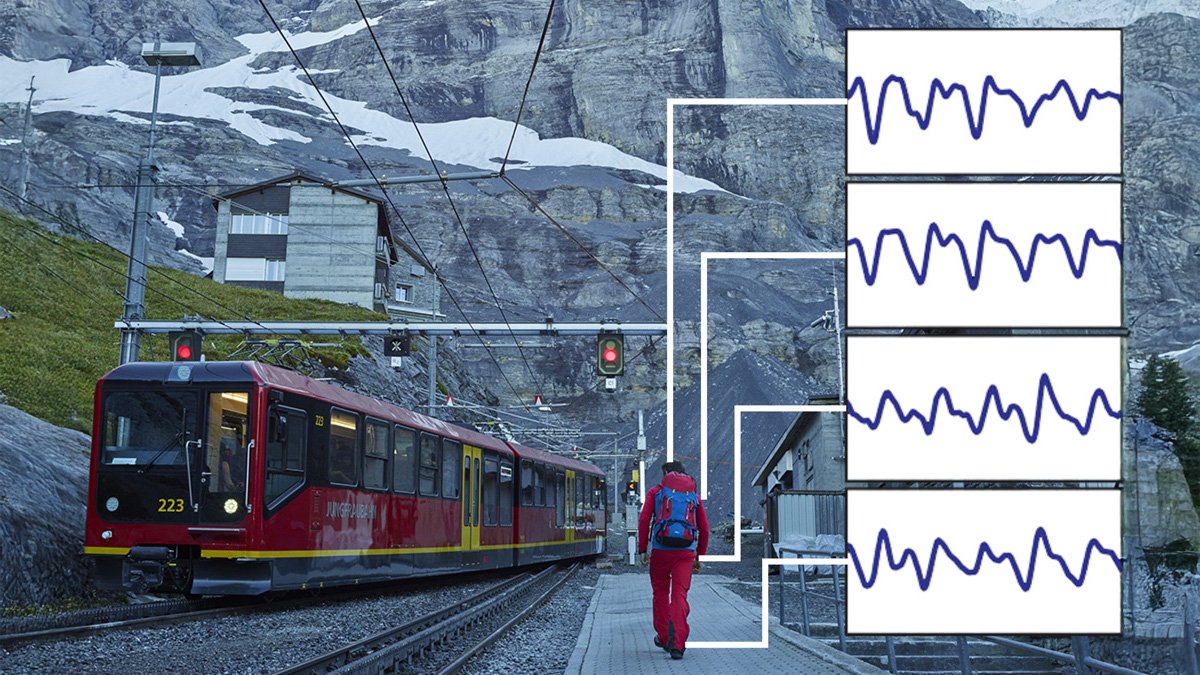
Figure 2. A method to remotely measure a person’s sympathetic arousal with a camera. Using a sliding window approach, we estimate a person’s peripheral blood flow changes from the video of a person’s face or palm. We show that these blood flow changes strongly correlate with a person’s electrodermal signals.
Study Apparatus
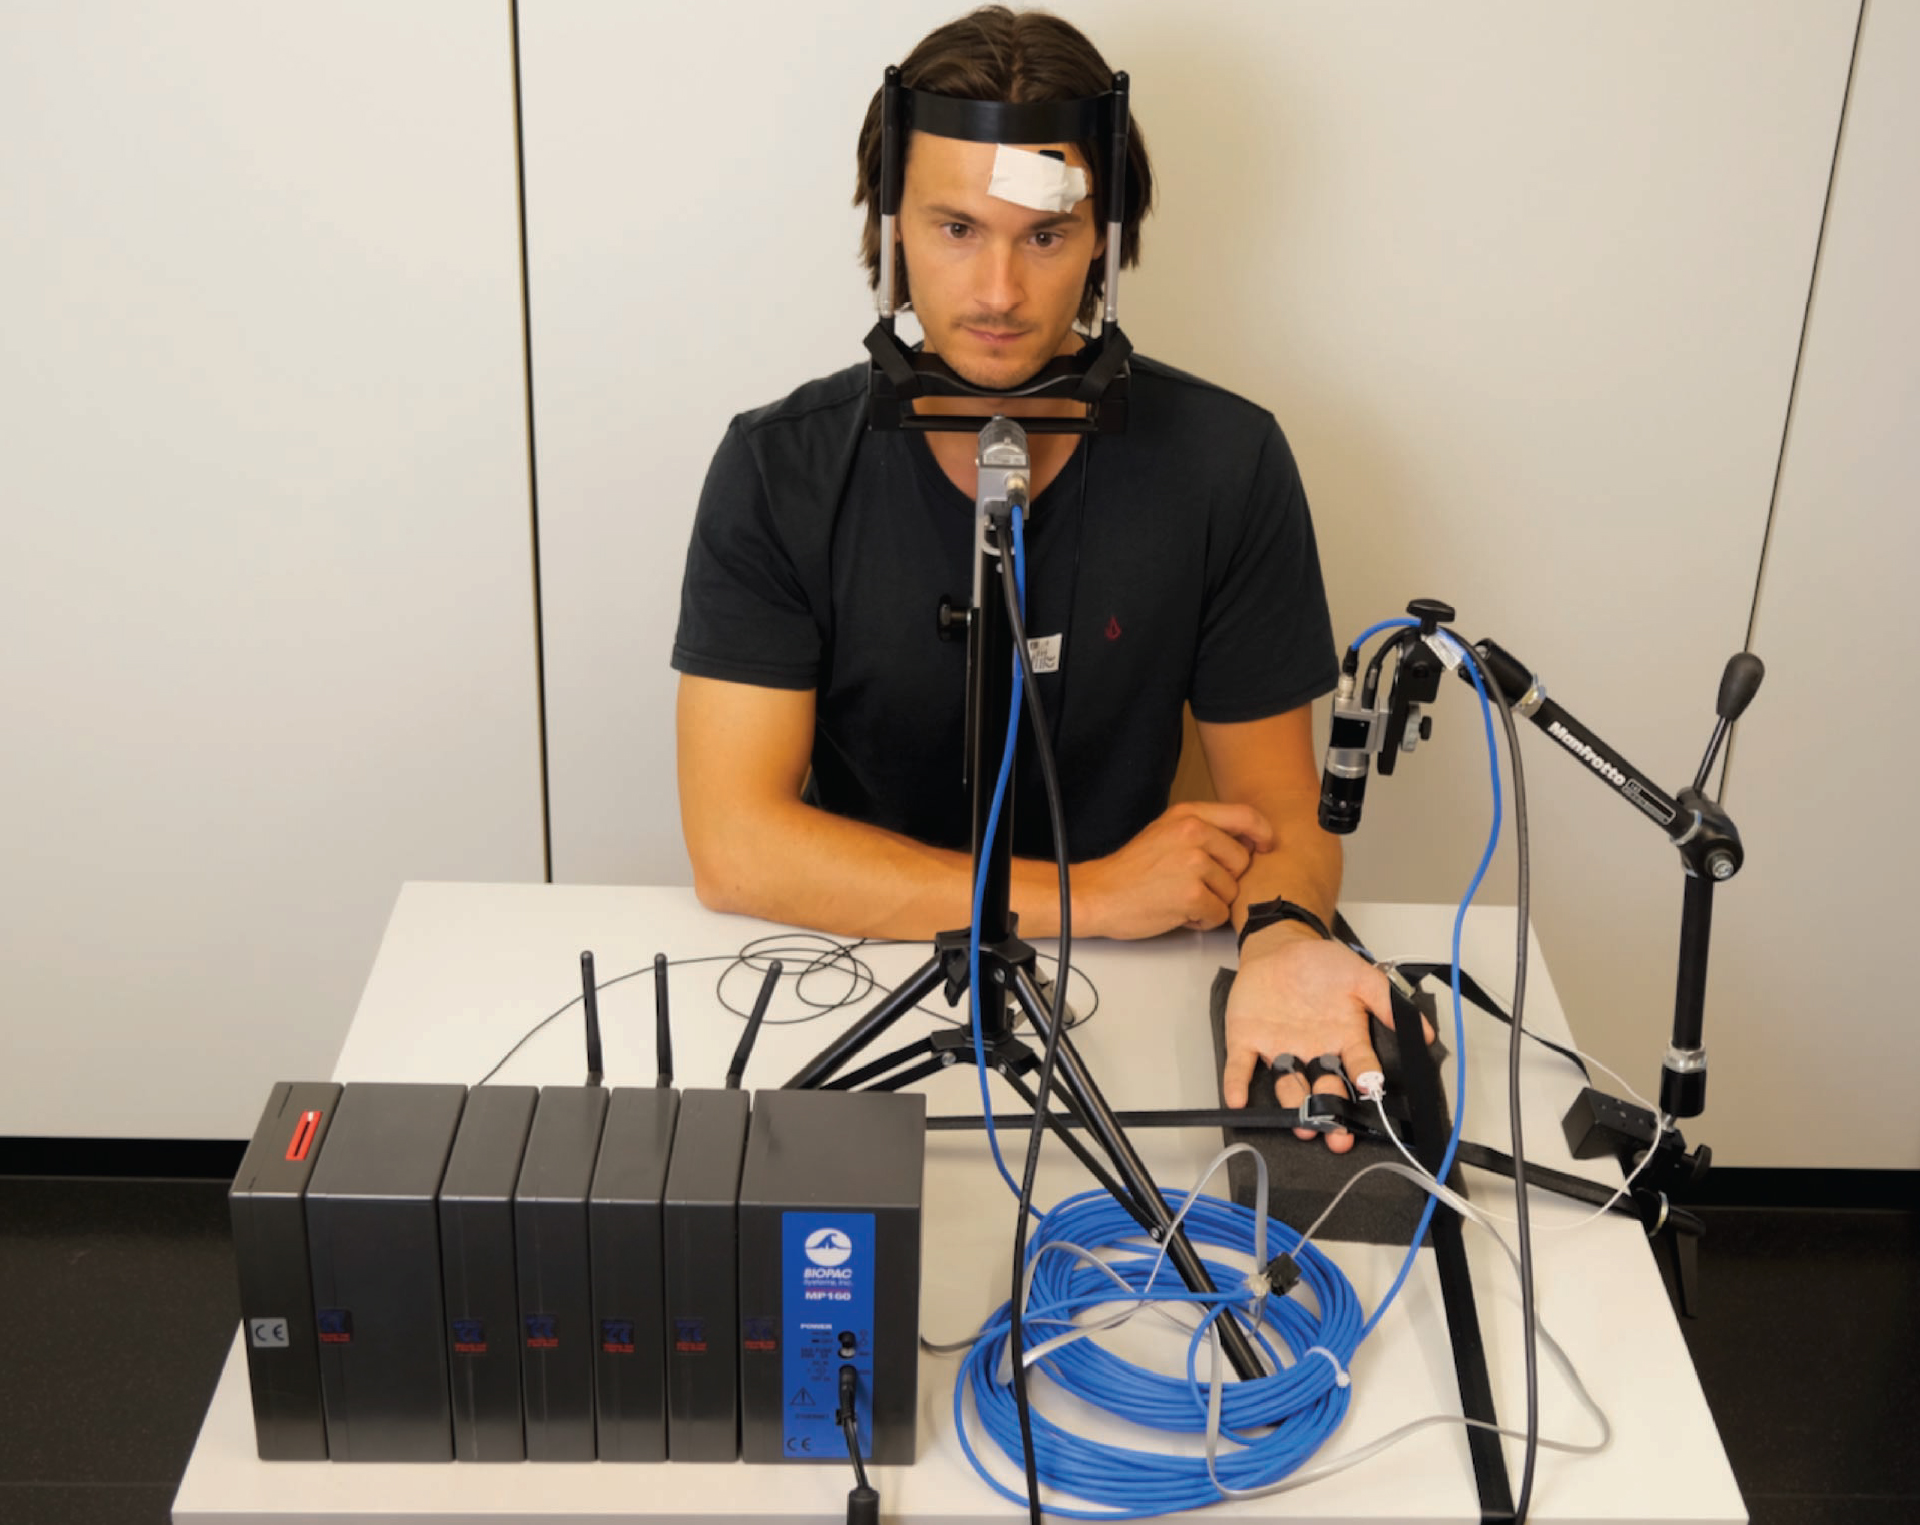
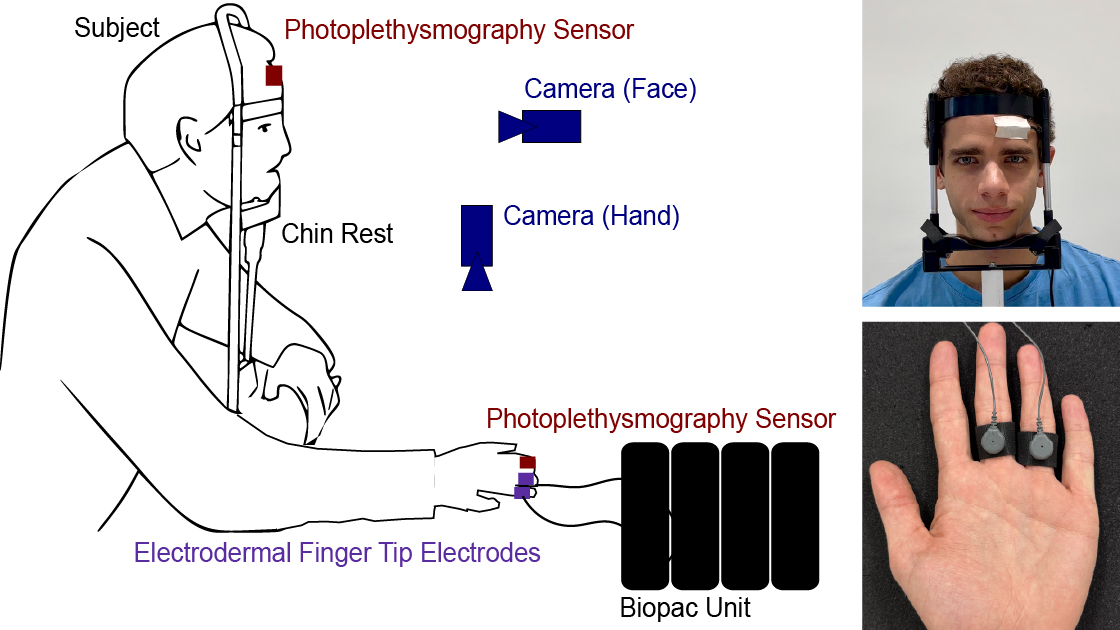
Figure 3. The overall setup of the study. The face and the palm of each participant are recorded using a Basler acA1300-200uccamera. The participant’s EDA signal is recorded on the fingers (ring and middle finger) of the non-dominant hand using two electrodes, and the two PPG signals are recorded on the forehead and at the index finger of the non-dominant hand. The participant uses the dominant hand to pinch the back of the non-dominant arm or the legs as a stressor to cause a spike in EDA. To minimize motion artifacts, the participant’s head is placed on a chin rest, and the thumb, middle finger, and ringer are placed under a belt such that they do not interfere with the physiological measurements.
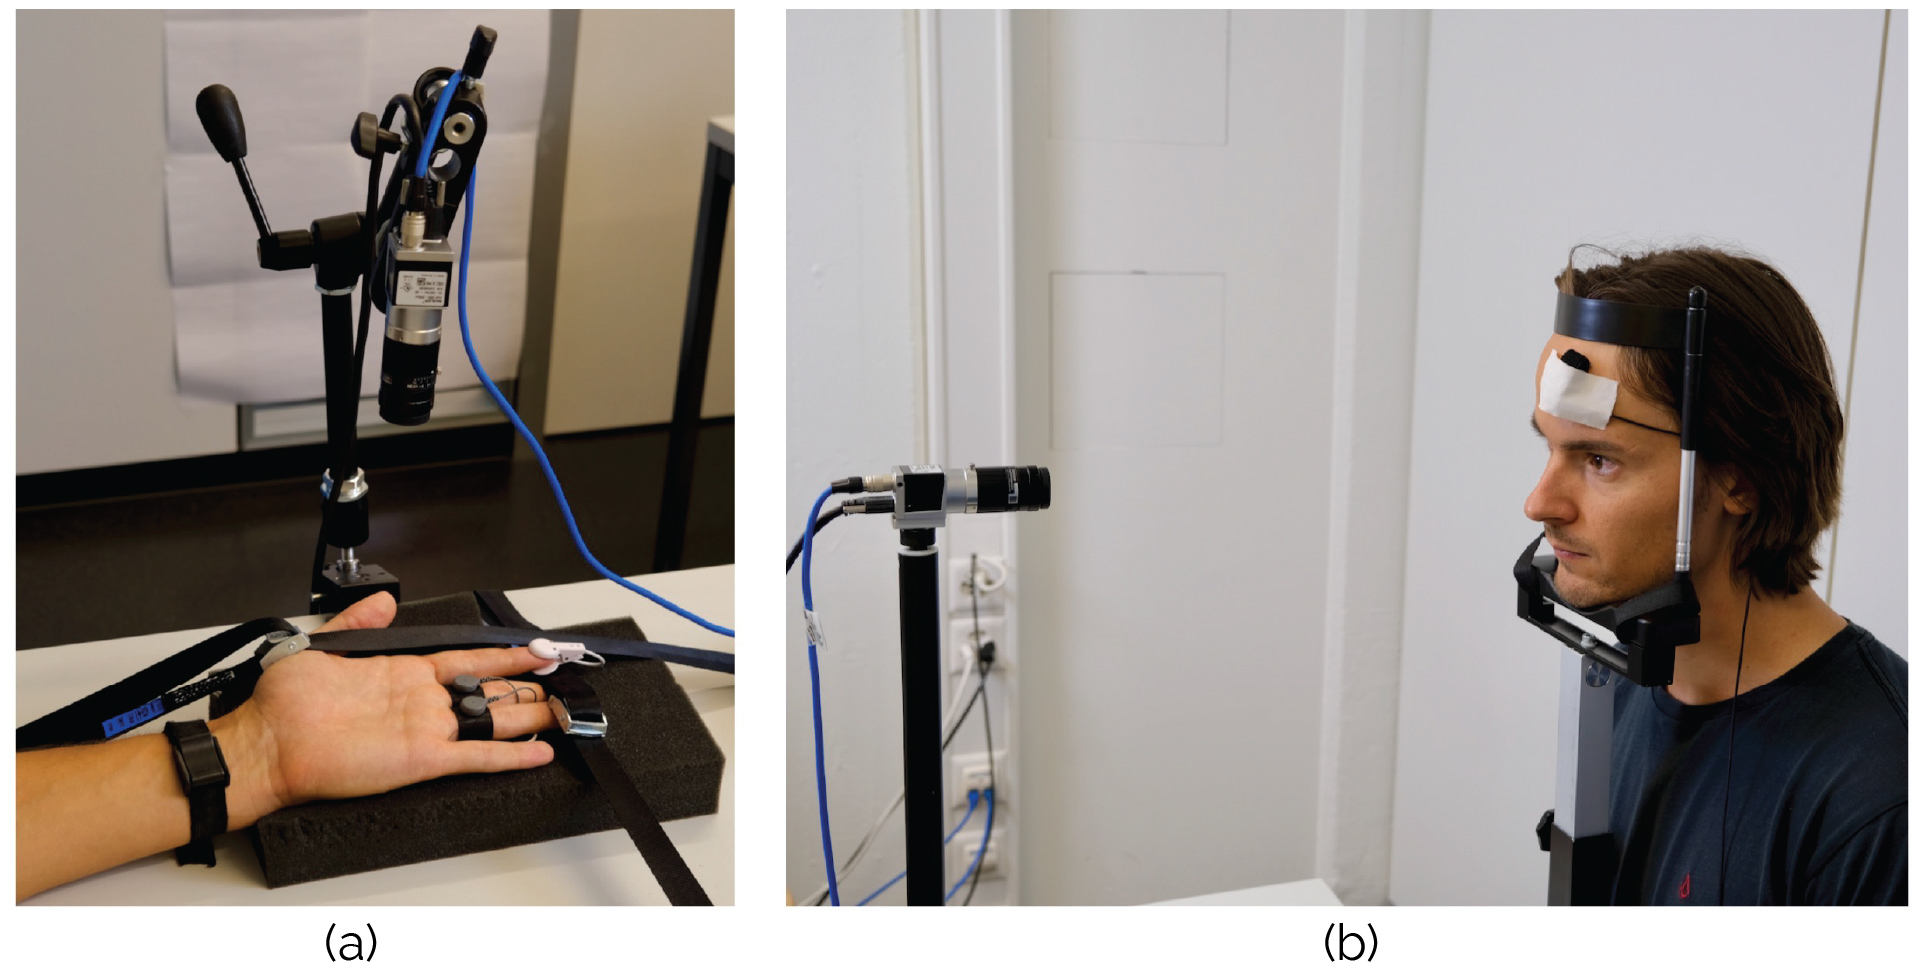
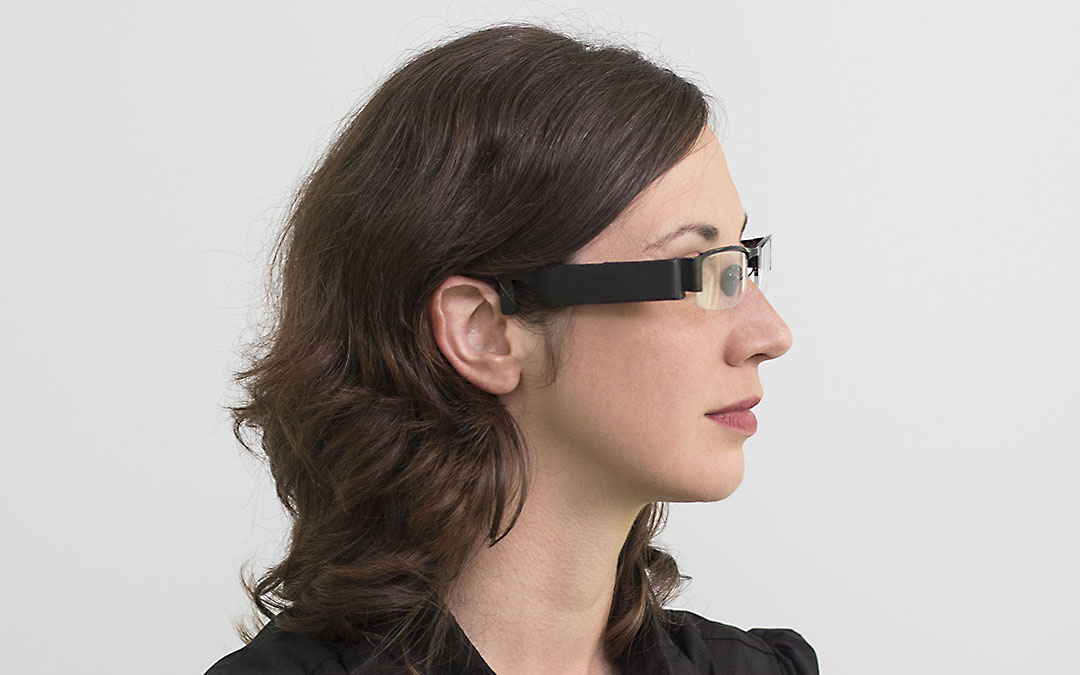
Figure 4. (a) The camera that records the participant’s palm. The participant’s thumb, ring finger, and middle finger are placed under a belt to minimize any possible motion of the hand. The participant’s EDA signal and PPG signal were recorded from the index (PPG), middle(EDA), and ring fingers (EDA). (b) The camera that records the participant’s face. The participant’s face is placed on a chin rest to minimize any motion of the head. The PPG sensor is fixed with medical tape on the forehead of the participant.
Results
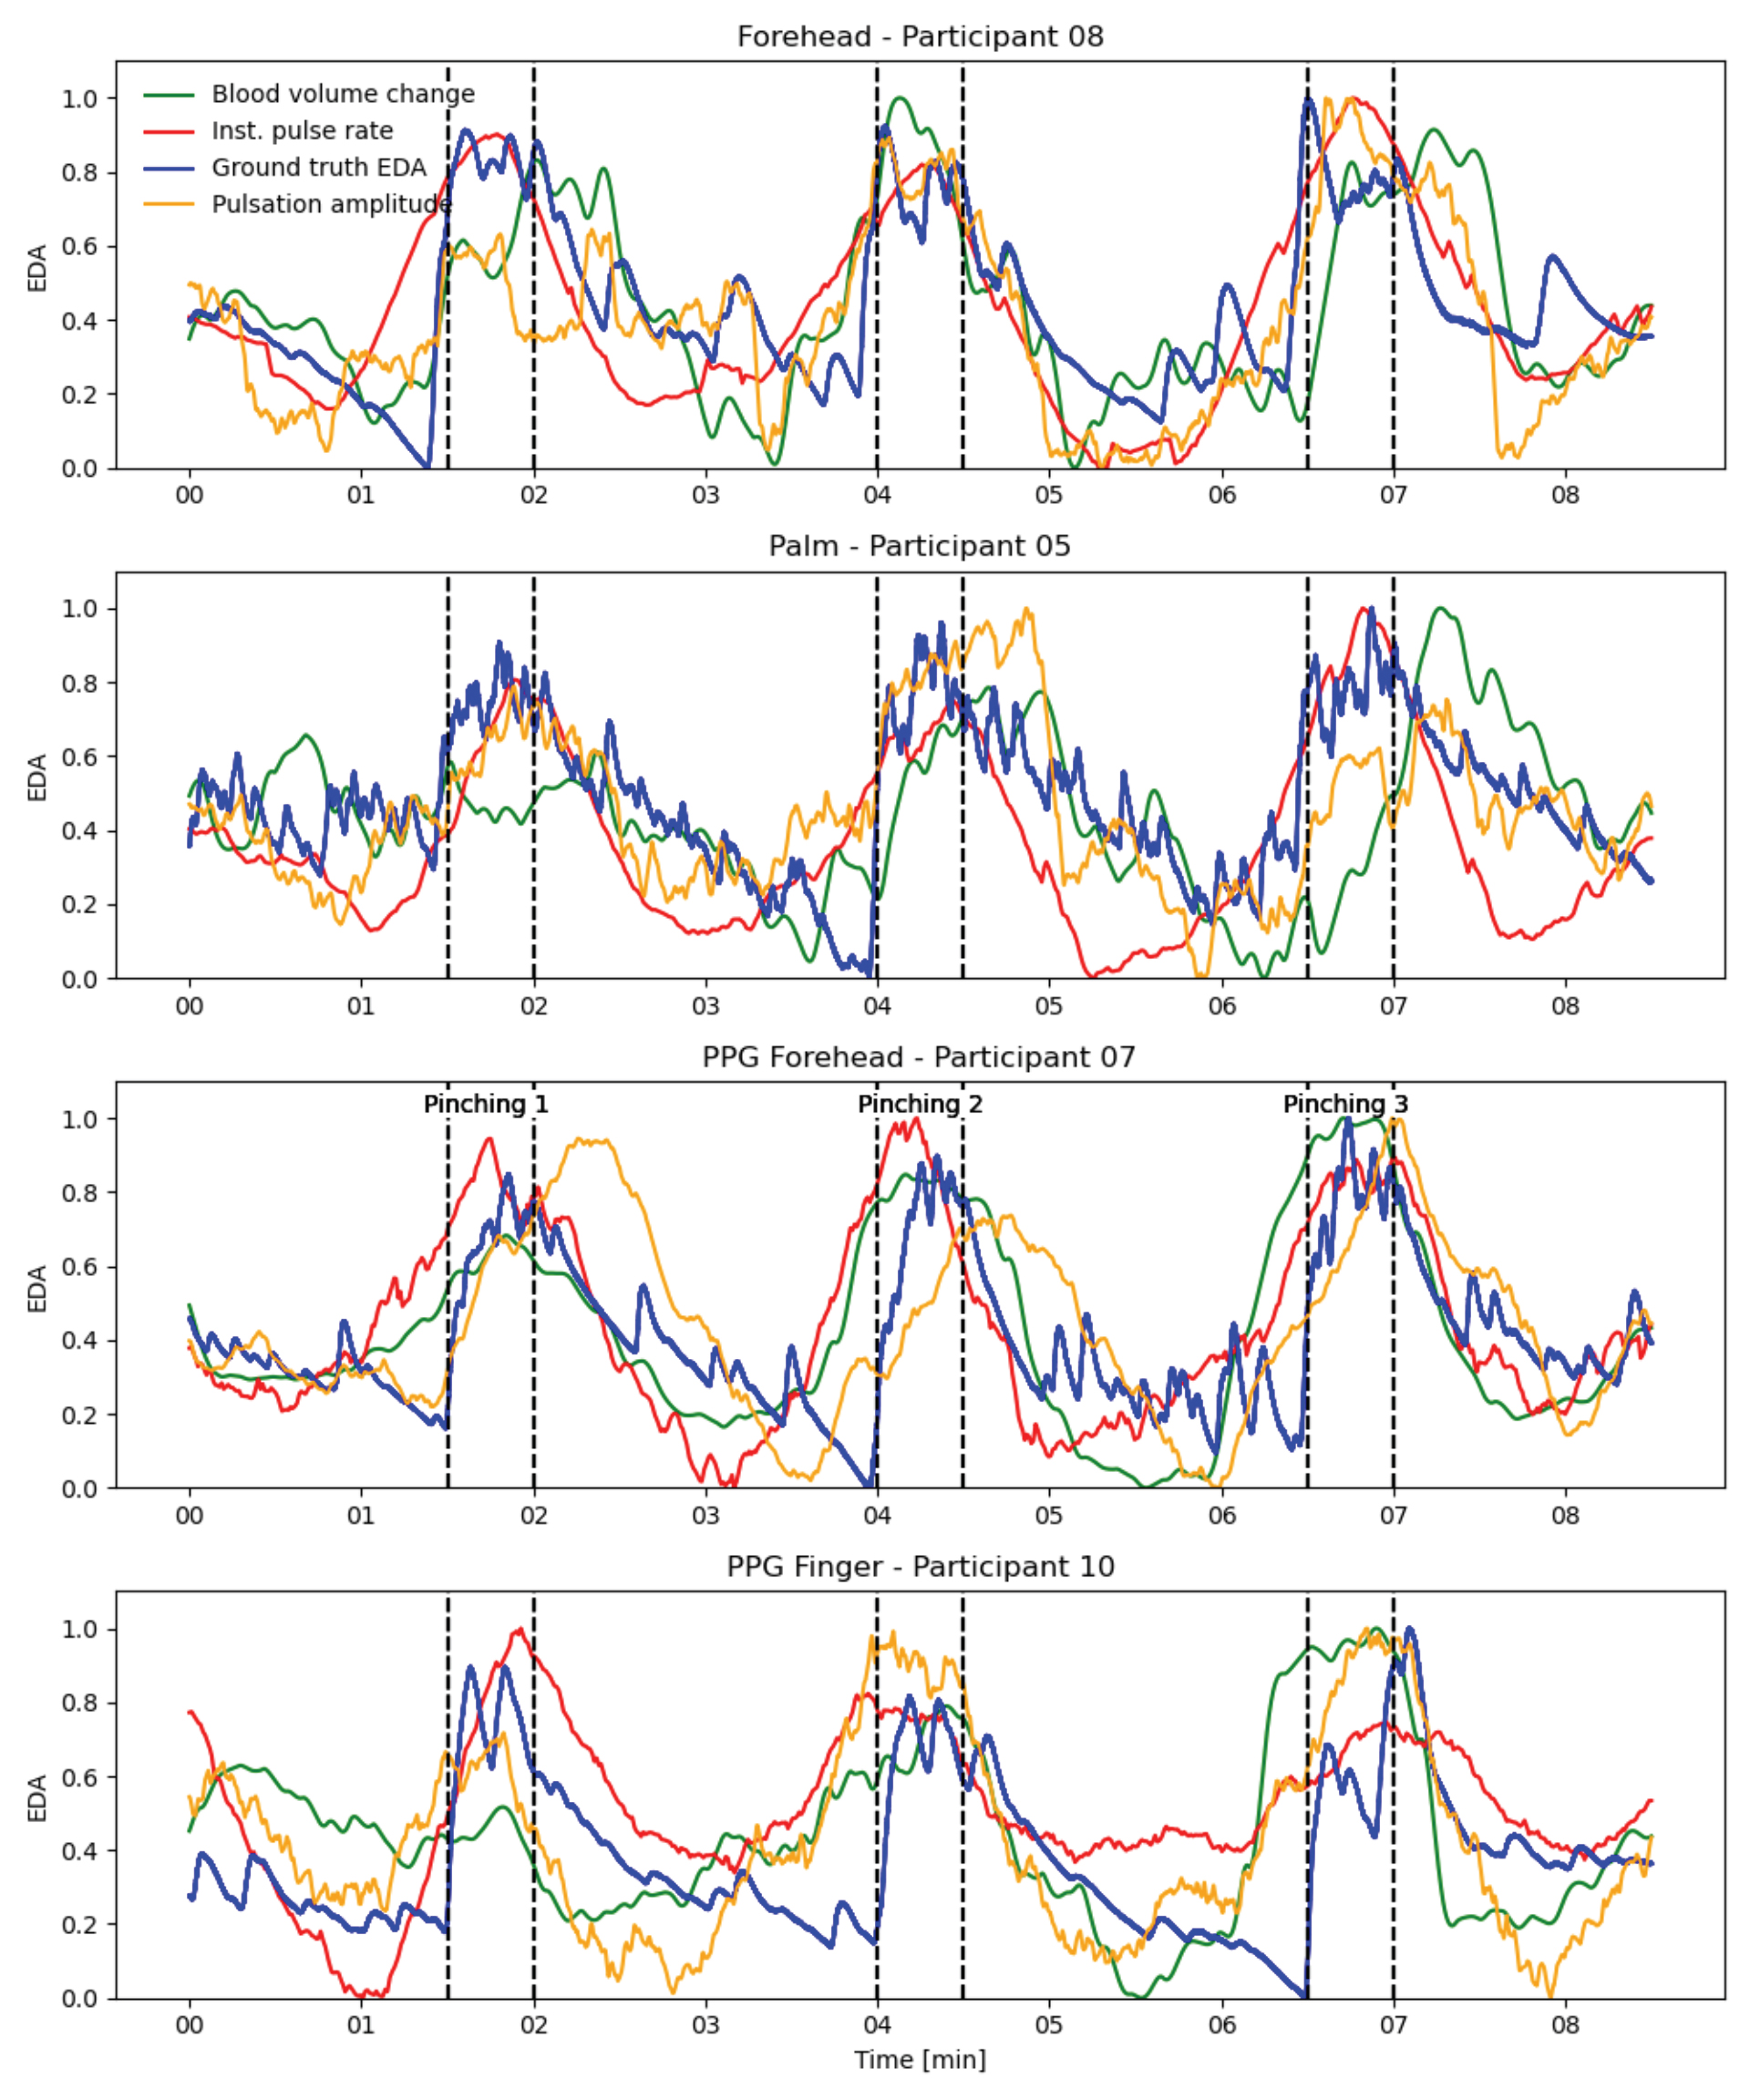
Figure 5. Visual comparison between the ground truth EDA and the calculated sympathetic responses. This plot shows the ground truth EDA signals, the calculated total blood volume changes, and the calculated instantaneous pulse rates for four exemplary participants using the four different input signals for four representative participants. The correlations between the calculated signals and the ground truth EDA signals are between 0.50 and 0.75.